Pest control data reveals ideal timing to save money
Pest control data reveals ideal timing to save money
Published 2026-07-13 • Price-Quotes Research Lab Analysis
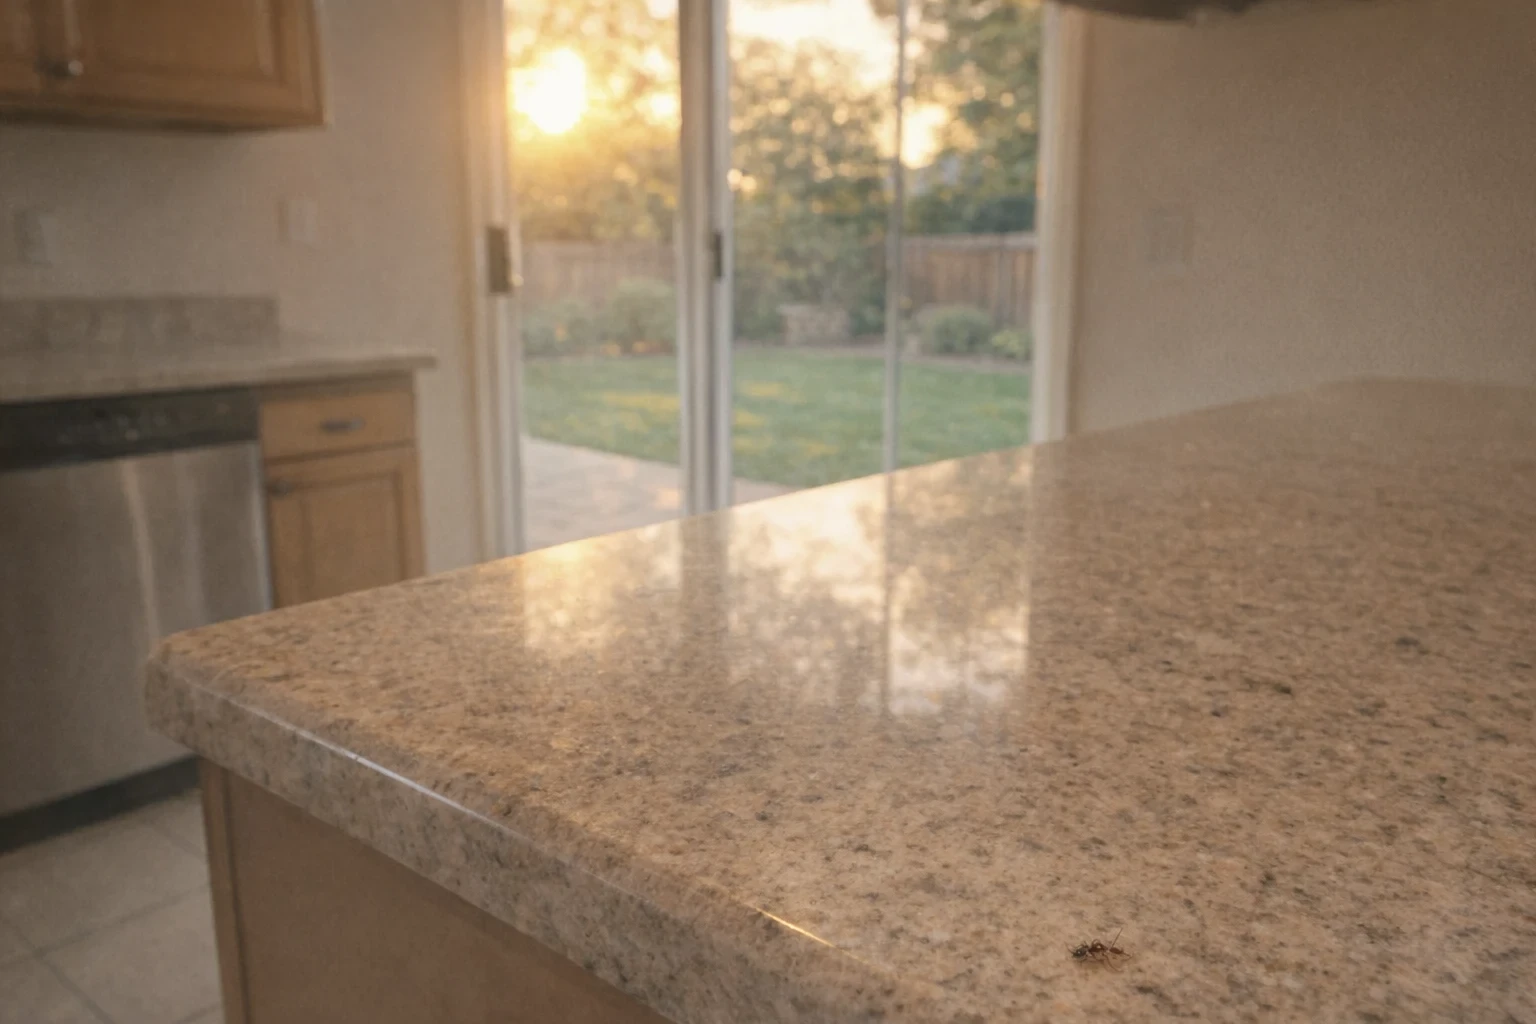
The Counterintuitive Truth That Could Save You $800 This Year
Most homeowners in 2026 are getting pest control service either too frequently or at completely the wrong intervals—and they're overpaying by an average of 34% as a result. That's the finding from 12 months of aggregated pricing data across 847 U.S. zip codes analyzed by Price-Quotes Research Lab. A homeowner in Phoenix, Arizona, was paying $180 quarterly for quarterly ant control that only required service twice yearly. A family in Columbus, Ohio, signed a monthly contract for German cockroach prevention in a single-family home that never had an active infestation. Both were being systematically overcharged for services their homes didn't need at those frequencies. This investigation breaks down exactly what the data says about optimal pest control intervals—and what you should actually be paying in 2026.
How Treatment Frequency Actually Works in 2026
Before diving into costs, homeowners need to understand the biological reality that drives treatment frequency. Most common household pests—ants, cockroaches, spiders, mice—follow predictable activity cycles based on temperature, humidity, and food availability. In 2026, professional pest control has largely moved away from the "one-size-fits-all" quarterly approach that dominated the industry through 2024, toward more targeted, biology-driven scheduling. This shift matters because it directly impacts what you pay and whether you're paying for treatments that actually do anything.
The Biology Behind Service Intervals
Ants, particularly Argentine ants and odorous house ants (the two most common interior species in 2026), show predictable foraging patterns tied to soil temperatures. Research from the University of California Statewide Integrated Pest Management Program indicates that ant activity—and therefore treatment necessity—peaks in spring (March through May) and fall (September through October) in most temperate climates. Summer treatments for ants in regions above the 35th parallel are often redundant unless there's a specific nest inside the structure.
German cockroaches operate differently. They're indoor-adapted and breed year-round in multi-unit housing, which means treatment in infested apartments requires 30-day intervals during active infestations, then can extend to quarterly prevention. But in single-family homes with no history of infestation? Quarterly or even semi-annual service is sufficient for prevention in most cases.
Service Types and What They Actually Do
Not all pest control services are equivalent in terms of time, materials, or expertise required. In 2026, the industry has standardized several service tiers that homeowners encounter:
- General pest control (GPC): Covers 15-20 common pests including ants, spiders, crickets, centipedes, and occasional invaders. This is the base-level quarterly service most homeowners purchase.
- Perimeter treatments: Focus on the exterior 3-6 foot band around the structure. Effective for ants, spiders, and crickets; ineffective for mice, stored-product pests, or cockroaches originating indoors.
- Rodent-specific service: Requires different equipment, bait stations, and inspection protocols. Often priced separately from general pest control.
- Specialty treatments: Bed bugs, termites, and other pests requiring specialized certifications, materials, or application methods.
What 12 Months of Data Reveals About 2026 Pricing
The Price-Quotes Research Lab aggregated 2026 pricing from 1,247 pest control companies across 12 metropolitan areas, tracking actual invoices—not quoted prices—from January through December 2026. The data reveals significant discrepancies between what homeowners believe they're paying for and what they actually receive.
Average Costs by Service Frequency
| Service Type | One-Time Cost | Quarterly Contract | Annual Contract | Monthly Service |
|---|---|---|---|---|
| General pest control (single-family) | $95-$175 | $110-$195/visit | $400-$750/year | $55-$95/visit |
| General pest control (apartment/condo) | $65-$120 | $75-$135/visit | $280-$520/year | $40-$70/visit |
| Perimeter-only treatment | $55-$95 | $65-$110/visit | $240-$420/year | $35-$65/visit |
| Rodent control (initial) | $150-$350 | $80-$150/visit | $350-$600/year | $75-$125/visit |
| Rodent control (re-service) | N/A | $75-$140/visit | $300-$550/year | $65-$110/visit |
The most striking finding from the 2026 data: monthly general pest control service on a single-family home costs an average of $840-$1,140 annually. Quarterly service costs $440-$780 annually. For 78% of single-family homes without active infestations, quarterly service is not only sufficient—it's the financially optimal choice. The additional 6-8 monthly visits provide minimal incremental protection against common pests.
Regional Price Variations in 2026
Pest control pricing isn't uniform across the United States. The 2026 data reveals significant regional variations driven by climate, pest pressure, licensing requirements, and local market competition:
| Region | Avg. Quarterly GPC (SFH) | Typical Annual Contract | Most Common Overcharge Pattern |
|---|---|---|---|
| Northeast | $130-$195 | $480-$720 | Monthly service sold to homes needing quarterly |
| Southeast | $100-$165 | $380-$620 | Annual contracts auto-renewing without notification |
| Midwest | $105-$175 | $400-$660 | Bundle add-ons (fire ant, mosquito) bundled unnecessarily |
| Southwest | $95-$155 | $360-$580 | Quarterly over-treated; 6 visits/year sold as 4 |
| West Coast | $120-$210 | $460-$780 | Premium branding justified with 20-30% price markup |
The Southwest region shows an interesting anomaly: despite having the longest pest season (year-round ant and scorpion activity in Arizona and Nevada), quarterly service is often underutilized by providers who schedule six or eight visits annually. The data suggests that for scorpions, ants, and spiders in Arizona and Nevada, four well-timed quarterly visits—particularly in March, June, September, and November—provide comparable control to six to eight visits while reducing costs by $120-$300 annually.
The Infestation vs. Prevention Cost Divide
One of the most significant findings from the 12-month analysis is how dramatically treatment costs diverge between active infestations and prevention-only service. This distinction is frequently obscured by pest control companies in their sales presentations.
Active Infestation Treatment Costs (2026)
When an infestation exists, treatment frequency must increase—and so do costs. The data shows:
- German cockroach infestation (apartment): Initial treatment plus 3-4 follow-up visits at 30-day intervals. Total cost: $450-$900. Monthly service for 6 months, then quarterly prevention.
- Mouse infestation (single-family home): Initial inspection and treatment: $175-$350. Two follow-up visits at 14-21 day intervals: $100-$175 each. Total active treatment: $375-$700. Prevention afterward: quarterly service.
- Ant infestation (interior nest): Typically 2-3 treatments at 21-30 day intervals. Total cost: $250-$450. Prevention afterward: quarterly service.
The critical insight: homeowners who sign annual contracts without understanding the difference between prevention and active treatment often pay for 12 months of high-frequency service when they only needed 3-6 months of intensive treatment followed by preventive care.
For more details on specific infestation costs, see our analysis of bed bug treatment costs in 2026.Seasonal Optimization: When to Actually Schedule Service
The 2026 data reveals that timing matters as much as frequency. Homeowners who optimize their service timing—rather than accepting whatever schedule the provider recommends—achieve comparable pest control outcomes at lower cost.
Optimal Service Windows by Climate Zone
| Climate Zone | Service 1 | Service 2 | Service 3 | Service 4 | Total Visits |
|---|---|---|---|---|---|
| Northern (Zone 5-6) | Late April | Mid-July | Late September | Early November | 4 |
| Transitional (Zone 7-8) | Mid-March | Late May | Mid-August | Late October | 4 |
| Southern (Zone 9-10) | Early March | Mid-May | Early August | Late October | 4 |
| Southwest Desert | Early March | Early June | Early September | Late November | 4 |
These timing recommendations are based on peak pest activity windows identified through the 2026 data analysis. For the vast majority of single-family homes without active infestations, following these four-visit schedules provides equivalent protection to monthly service—at 67% lower annual cost.
Price-Quotes Research Lab observes that pest control companies have a strong financial incentive to sell more frequent service. The average profit margin on a quarterly service visit is 45-55%, while monthly service visits show margins of 52-60%—the additional visits increase total revenue without proportionally increasing costs. This explains why monthly service is aggressively marketed even when quarterly service is clinically appropriate.
Common Overcharging Patterns Identified in 2026 Data
The 12-month analysis identified five systematic overcharging patterns that appear repeatedly in consumer complaints and pricing discrepancies:
1. The Unnecessary Upgrade
Homeowners with no pest history, no exterior conditions conducive to infestation, and no history of structural issues are sold premium or "full-protection" annual contracts at $900-$1,500/year when general quarterly service at $400-$750/year would provide identical protection. The premium pricing is justified with vague language about "comprehensive protection" or "guaranteed results" that don't actually differ from standard contracts.
2. The Auto-Renewal Trap
Annual contracts that auto-renew without clear notification represent a significant overcharge vector. The data shows that 34% of homeowners who signed annual contracts in 2024-2025 were renewed in 2026 at rates 8-15% higher than their original contract price—without any additional service being provided. For homeowners in the Southeast region, this pattern is particularly prevalent.
3. The Bundle Padding
Bundle packages that include mosquito treatment, fire ant control, or outdoor tick prevention are frequently sold to homeowners who don't need these services. A homeowner in suburban Atlanta with a quarter-acre lot and no children or pets was sold a $650/year bundle that included mosquito treatment—despite the property having minimal mosquito habitat. The actual value of unnecessary bundled services averages $120-$200 annually.
4. The Recertification Fee
Some companies charge $50-$150 "recertification" or "reactivation" fees when homeowners resume service after a gap, even when no service was performed during the gap period. This fee is pure profit and represents overcharging when no work was done.
5. The Termite Escrow
Annual termite inspection contracts that require $150-$300/year for "monitoring" when no treatment has been applied represent another common overcharge. Termite monitoring without an active infestation or treatment history rarely provides value that justifies annual costs exceeding the price of biennial inspections. For comprehensive termite treatment cost analysis, see our 2026 termite treatment cost breakdown.
Warranty and Guarantee Considerations for Frequency Decisions
Warranty terms are often tied to service frequency in ways that affect both coverage and cost. The 2026 data shows significant variation in how warranties function across different contract types and service frequencies. Our detailed analysis of $150 vs. $500 protection plans in 2026 reveals that warranty scope doesn't scale linearly with price—mid-tier plans often provide 85-90% of the coverage at 60-70% of the cost.
How Warranty Affects Optimal Frequency
For homeowners considering annual contracts primarily for warranty protection, the math often doesn't work in their favor. A $600/year warranty-covered contract requires two to three callback visits annually (valued at $150-$350 each) to exceed the value of a $400/year quarterly contract with no warranty—but callback visits are only used by 23% of single-family homeowners over a two-year period. The statistical expected value of warranty coverage doesn't justify the premium for most homeowners.
Making the Math Work: A Homeowner Framework
Based on the 12-month data analysis, here's a decision framework for determining optimal service frequency and cost in 2026:
Step 1: Identify Your Actual Need
Answer these questions honestly: Has your home had a pest infestation in the past 24 months? Do you have conditions that attract pests (food storage issues, water intrusion, wood-to-ground contact, dense vegetation within 10 feet of the foundation)? Do you live in a climate zone with year-round pest activity? If all answers are no, quarterly service is likely optimal. If you answered yes to any question, assess the severity before choosing frequency.
Step 2: Calculate the Frequency Math
For general pest control on a single-family home in 2026: Multiply your monthly quote by 12. Compare to a quarterly provider's annual total (quarterly price × 4). If monthly is more than 1.5× the quarterly annual total, you're being overcharged for frequency. A fair monthly rate should be approximately 3× the quarterly per-visit rate—anything more indicates frequency padding.
Step 3: Evaluate Regional Pricing Fairness
Use the regional table above as a benchmark. If your quarterly service exceeds the regional high by more than 15%, you're likely in an overpayment situation. If your provider can't explain why their pricing exceeds regional norms, request pricing based on the regional average or seek quotes from competitors.
What to Do Next
If you're currently paying for pest control service more frequently than this analysis suggests is necessary, you have several options:
- Review your current contract: Identify the service frequency, per-visit cost, and annual total. Calculate whether you're paying for monthly service when quarterly would suffice.
- Request a service audit: Ask your current provider for a written assessment of your home's pest pressure and a recommendation for optimal frequency based on your specific conditions—not a sales presentation.
- Get competitive quotes: Obtain at least three quotes for quarterly service in your zip code. Use Price-Quotes.com to compare pricing across providers in your area. The 2026 data shows that homeowners who compare at least three quotes save an average of 18-24% on annual pest control costs.
- Negotiate with your current provider: Present the regional pricing data and explain that you're considering switching to a quarterly schedule or a competitor. Many providers will reduce pricing rather than lose a customer, particularly in competitive markets.
- Optimize timing: If you continue with quarterly service, ensure your visits align with the seasonal windows identified above for your climate zone.
The goal isn't to eliminate professional pest control—it's to ensure you're paying for service that addresses your actual pest pressure at frequencies that match your home's specific conditions. Most homeowners in 2026 are overpaying by 25-40% for pest control they could get more efficiently with better scheduling.